Charts
![]() Updated 3 years ago
by
admin
Updated 3 years ago
by
admin
The USS Gateway collects performance statistics which can be viewed locally to help understand where delays may exist. The charts are a good starting point for further troubleshooting if you are experiencing performance issues when browsing through the gateway.
For each available chart, you can select from a predefined period of time e.g. Last Hour, Day, Week or Month or you can use a Specific start and end date and time. Once the results are displayed in the chart, you can also click and drag to pan and zoom within the chart for further detail. You can double click the chart surface to zoom back out. If multiple series exist, you can use the legend to toggle them on or off in order to focus in on a particular series.
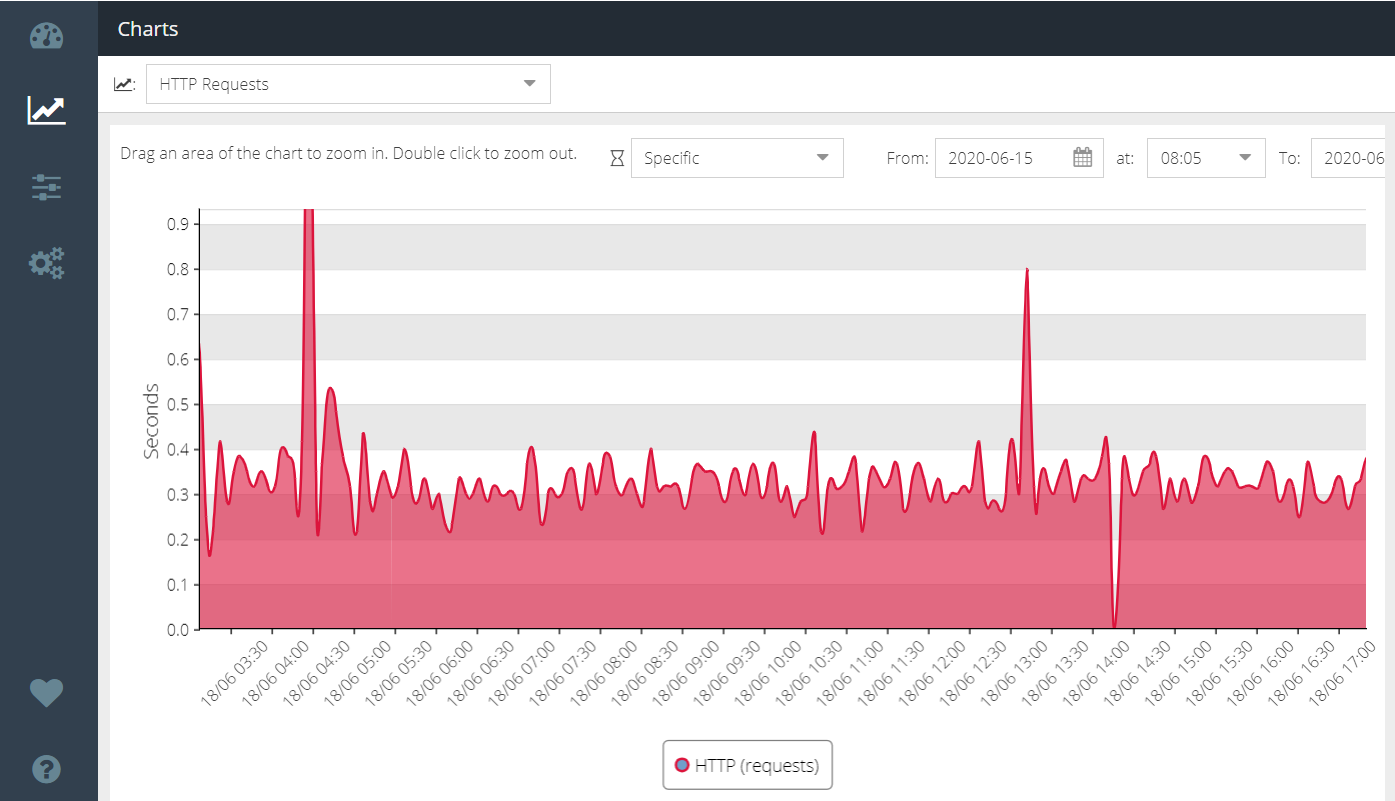
The following charts are available:
Bandwidth | The number of Kilobytes per second inbound (download) and outbound (upload) from the proxy |
HTTP Requests | The number of HTTP requests received by the proxy from clients (end user web browsers) per second. A browser can generate multiple requests per web site visit. |
Response Times | The average time in seconds for a DNS or HTTP response from the proxy to the client |