Activity Reports
The Activity reports provide the deepest level of insight into activity by product and also allows you to save and download report data.
Running Activity Reports
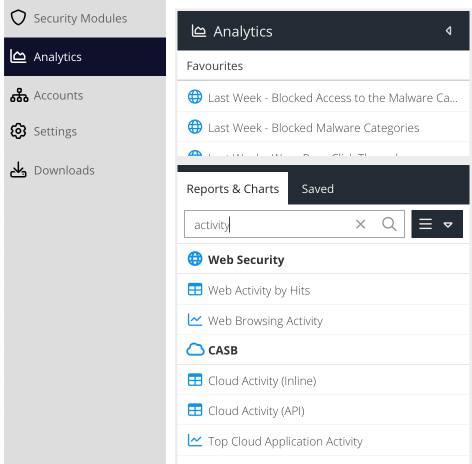
Open your USS Dashboard and select Analytics. Select or search for the report name in the Reports & Charts tab.
The Activity report type is identified with the  icon. This means these reports return detailed results and support filtering.
After selecting a report, the report will open in a new tab in the right-hand panel.

All Activity reports have the following options:
Filters
Close or open the filters that are available for this specific report.
Run Report
Run the report with the current timespan and filter selection.
Download
Download the report.
Save
Save the report for use as a favourite or in report schedules.
Manage Products
Switch to product management for the product this report belongs to.
Running Reports and Limitations
All dashboard based reports are limited to a maximum 2 minute run time. In most cases, this should be sufficient to return more than 1,000,000 results which is the maximum size of a file that can be opened in Excel.
If your report uses a relative time span e.g. Last Month but when you run it, it exceeds the 2 minute timeout, you can Save the report and then attach it to a schedule. A scheduled report will run in the background for up to 2 hours.
Web Activity by Hits
The Web Activity by Hits report is available as part of the Web Security product and is concerned with hits to websites, domains and IPs collected by agents or gateways deployed on your network.
The Web Activity reports support filters that allow you to query the data with custom search criteria. To set a filter, click the Filters button before running the report.

Domain
Part of the domain that you are searching for e.g. gaming.com, www.bbc.co.uk, .net, etc - path or query string are not supported
Username
Part of the username (Active Directory) that made the web requests. This may only be available if agents are deployed with user identification or authentication.
admin; sysadmin.MAC address
The physical or machine address of the device that made the web requests, e.g. AE:B1:7F:12:A0:B7 (not available when using the Chromebook agent).
IP address
The IP address of the device that made the web requests e.g. 10.0.0.5, 172.16.1.1 (not available when using the Chromebook agent)
Hostname
Part of the hostname of the device that made the web requests. (not available when using the Chromebook agent)
Final Action
Select the final action applied by a rule to the web request, e.g. Allow, Block, Redirect.
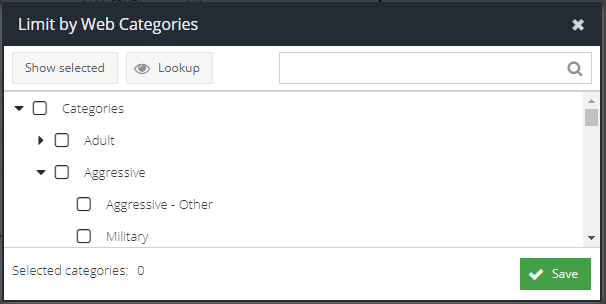
Limit By Web Category
Check this box to open the category picker. This allows you to select multiple Web Categories that the web request must have matched.
AD Group
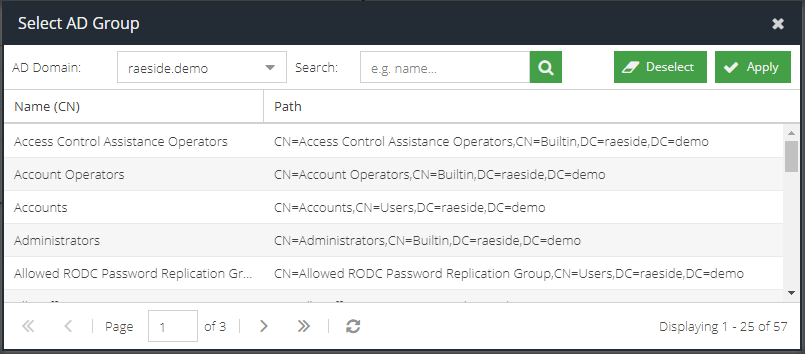
Check this box to open the AD Group picker. This allows you to select a group that the user who made the request must be a direct member of in Active Directory. After the picker opens, select the AD Domain and then select the desired group. Only one group can be selected.
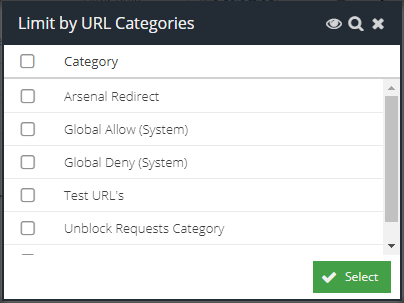
Limit By URL Category
Check this box to open the category picker. This allows you to select multiple custom URL Categories that the web request must have matched.
Filter Rule
The name of the Filter Rule that the web requests must have matched. This can also be used to detect sites blocked because they are "Unclassified" if this option is enabled.
Limit By Keyword Category
Check this box to open the category picker. This allows you to select multiple custom Keyword Lists that the web request must have matched.
Keyword
Enter in a Keyword List pattern that the web request must have matched, if you want to search on a specific keyword.
Tag
Select the tag that must have been applied to the web request.
Device Type
The type of device that made the web request. This technique uses the User Agent of the request to determine the type of device used e.g. Tablet, PC, Laptop, Smartphone
Log Level
The logging level set by the rule Log Level action
Exclude AJAX (XHR) requests
Remove any web requests that were generated by scripts. This is a best effort attempt and looks for the presences of the XMLHttpRequest header.
Click the  icon to generate the report results. It may take several seconds to generate the report depending on the size of the result set.
The report results will appear in the Results panel and will be ordered by timestamp.

The results are grouped by Visit. Click the + icon to expand the visit to see the individual hits belonging to the visit, including the full URL of each hit. Use the Details pane to view all of the collected meta data for a specific hit.
The default columns are displayed but additional columns can be included in the report. Hover over a column header, and expand the menu to view the available columns. You can add additional columns to the report which will be saved so that the same view appears each time the report is run.
The following columns are available (columns with a * are only available for the expanded hit view by clicking the + next to a result):
Column Name | Description |
URL | The URL requested |
Username | The Active Directory username captured by the agent |
Domain | The Active Directory domain name the user belongs to, or if not a domain member, the hostname or captured domain from the agent |
Group | The users Active Directory security group memberships |
OS | Operating system used to generate the hit (hidden by default) |
Device (Host) | The hostname of the device that generated the hit (the hostname should be registered in the Devices section) |
Device (MAC) | The MAC address of the device that generated the hit |
Device (IP) | The internal IP address of the device that generated the hit |
Timestamp (UTC) | The UTC timestamps of the request |
Timestamp (Local) | The local time of the request. This is calculated by the Time Zone detected by the agent and is relative to the user |
AD Domain | The Active Directory NetBIOS domain that the username is a direct member of |
Request Action | The final action that was applied to the request i.e. Allow, Block, Quota, Warn |
Response Action | The action carried out by the agent or gateway after scanning the response content (requires additional licenses such as anti-malware or DLP) |
Response Category | The category returned if a Response Action is present |
Response Module | The name of the module that triggered the Response Action e.g. Anti-malware (AV) or DLP, etc |
Web Categories | The Web Categories that the URL matched |
URL Categories | The custom URL Categories that the URL matched |
Keyword Categories | The Keyword Lists that the URL matched* |
Keyword Pattern | The patterns from the Keyword Lists that the URL matched |
Filter Rule | The name of the standard Filter Rule that triggered on the request, if any* |
Feature Control Name | The name of the Feature Control that triggered on the request, if any* |
Agent | The version of the agent in use e.g. Gateway, Windows, Mac OS X |
Tag | The tag that the agent was using when the hit was captured* |
Country | The country code that is determined by the IP address of the destination web server* |
Browser | The browser in use as determined by analysing the User-Agent header |
It is possible to sort the results on a particular column by clicking the column header to toggle between ascending and descending sort.
Cloud Activity (Inline)
The App Activity (Inline) report is available as part of the Cloud Application Security product and is concerned with providing a detailed analysis of user activity within Cloud Applications (app's). The App Activity (Inline) report is able to identify Shadow IT, by displaying the Cloud Applications in use in real time, the actions carried out within those applications (uploading, sharing, posting, etc) and even meta-data around the action carried out (file name, message, username, etc). This level of detail, combined with attributes from the App Catalog such as risk, provide a powerful insight into end-user behaviour and their use of Cloud Applications. Information from this report can be used to identify threats and sanction applications.
The App Activity (Inline) report allows searching based on the following criteria:

Username
Part of the username (Active Directory) that used the App.
MAC address
The physical or machine address of the device that made the requests, e.g. AE:B1:7F:12:A0:B7
IP address
The IP address of the device that made the requests e.g. 10.0.0.5, 172.16.1.1
Hostname
Part of the hostname of the device that used the App.
Service IP
The IP address of the destination cloud service
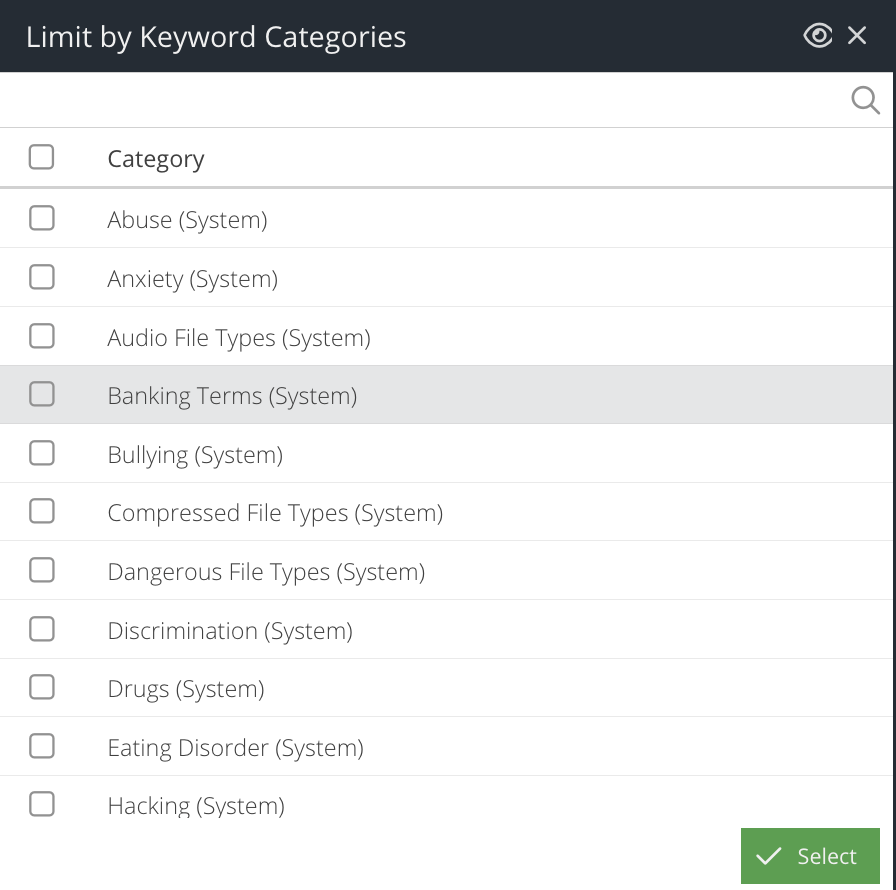
Limit by Keyword Category
Check this box to open the category picker. This allows you to select multiple Keyword Lists that the request must have matched.
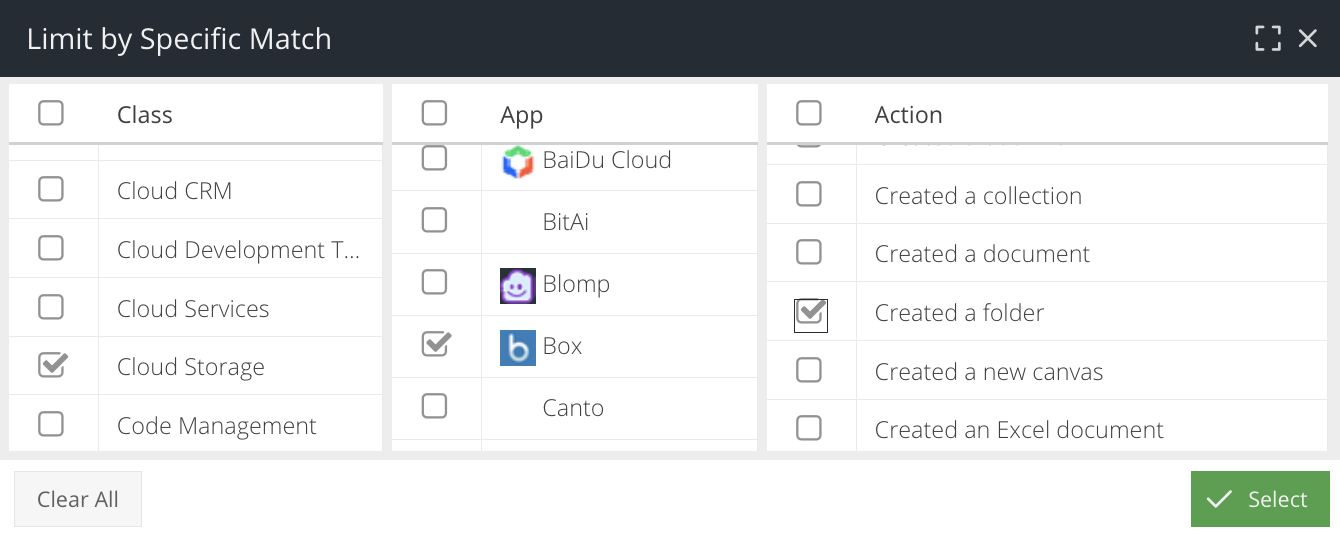
Limit by Specific Match
Check this box to open the Cloud Application selector and select a Class, Name or Action to search for.
Filter Rule
The name of the Filter Rule that the web requests must have matched. This can also be used to detect sites blocked because they are "Unclassified" if this option is enabled.
Final Action
Select the final action applied by a rule to the request, e.g. Allow, Block, Redirect.
Device Type
The type of device that made the request. This technique uses the User Agent of the request to determine the type of device used e.g. Tablet, PC, Laptop, Smartphone
Keyword(s)
One or more keywords (separated by semicolons) that appear in the captured Action Value meta-data. Useful for searching for filenames or Social Media activity.
Log Level
The logging level set by the rule Log Level action
Tag
Select the tag that must have been applied to the request.
Risk Level
The baseline or custom risk level that the App Action must have (coming soon)
Click the  icon to generate the report results. It may take several seconds to generate the report depending on the size of the result set.
The report results will appear in the Results panel and will be ordered by timestamp.

The results are grouped by App Action. Click the + icon to expand the activity to see the meta data captured for the action.
The default columns are displayed but additional columns can be included in the report. Hover over a column header, and expand the menu to view the available columns. You can add additional columns to the report which will be saved so that the same view appears each time the report is run.
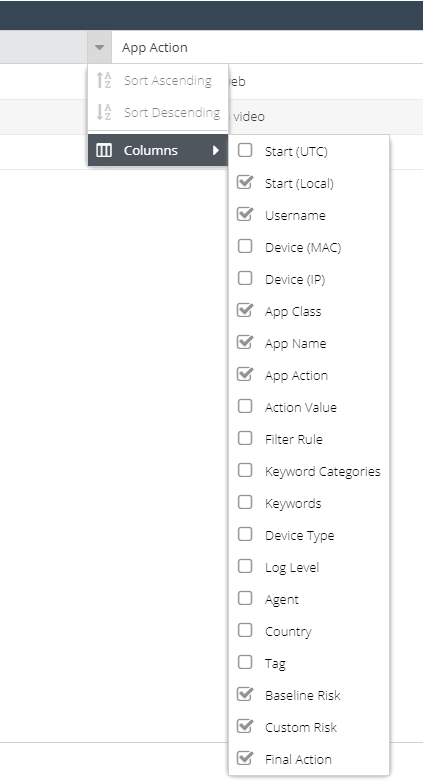
The following columns are available:
Column Name | Description |
Timestamp (UTC) | The UTC timestamps of the first hit in the visit, or the UTC time of the hit |
Timestamp (Local) | The local time of the first hit in the visit, or the local time of the hit. This is calculated by the Time Zone detected by the agent. |
Username | The Active Directory username captured by the agent |
Device (Host) | The hostname of the device that generated the hit (the hostname should be registered in the Devices section) |
Device (MAC) | The |
Device (IP) | The internal IP address of the device that generated the hit |
OS | Operating system used to generate the hit |
Device Type | The type of device that made the request, identified via User Agent header |
AD Domain | The Active Directory NetBIOS domain that the username is a member of |
App Class | The classification of the Cloud Application e.g. CRM, Storage, Social Networking from the App Catalog |
App Name | The name of the Cloud Application from the App Catalog |
App Action | The name of the action from the App Catalog that was carried out within the Cloud Application e.g. Uploaded a File, Attempted to Login |
Keyword Categories | The Keyword Lists that the URL matched |
Keywords | The patterns from the Keyword Lists that the URL matched |
Tag | The tag that the agent was using when the hit was captured |
Action Value | The captured meta-data from the App Action |
Baseline Risk | The risk level for the App Action set in the App Catalog |
Custom Risk | The risk level set by the administrator by overriding the baseline value in the App Catalog |
Final Action | The final action applied by a rule to the request, e.g. Allow, Block, Redirect |
Browser | The name of the Web browser in use e.g. Chrome, IE |
ICAP Agent | The version of the USS agent in use when the request was captured |
Country | The GeoIP country determined from the destination IP address of the web request |
Filter Rule | The name of the Filter Rule that matched when the request was captured |
It is possible to sort the results on a particular column by clicking the column header to toggle between ascending and descending sort.
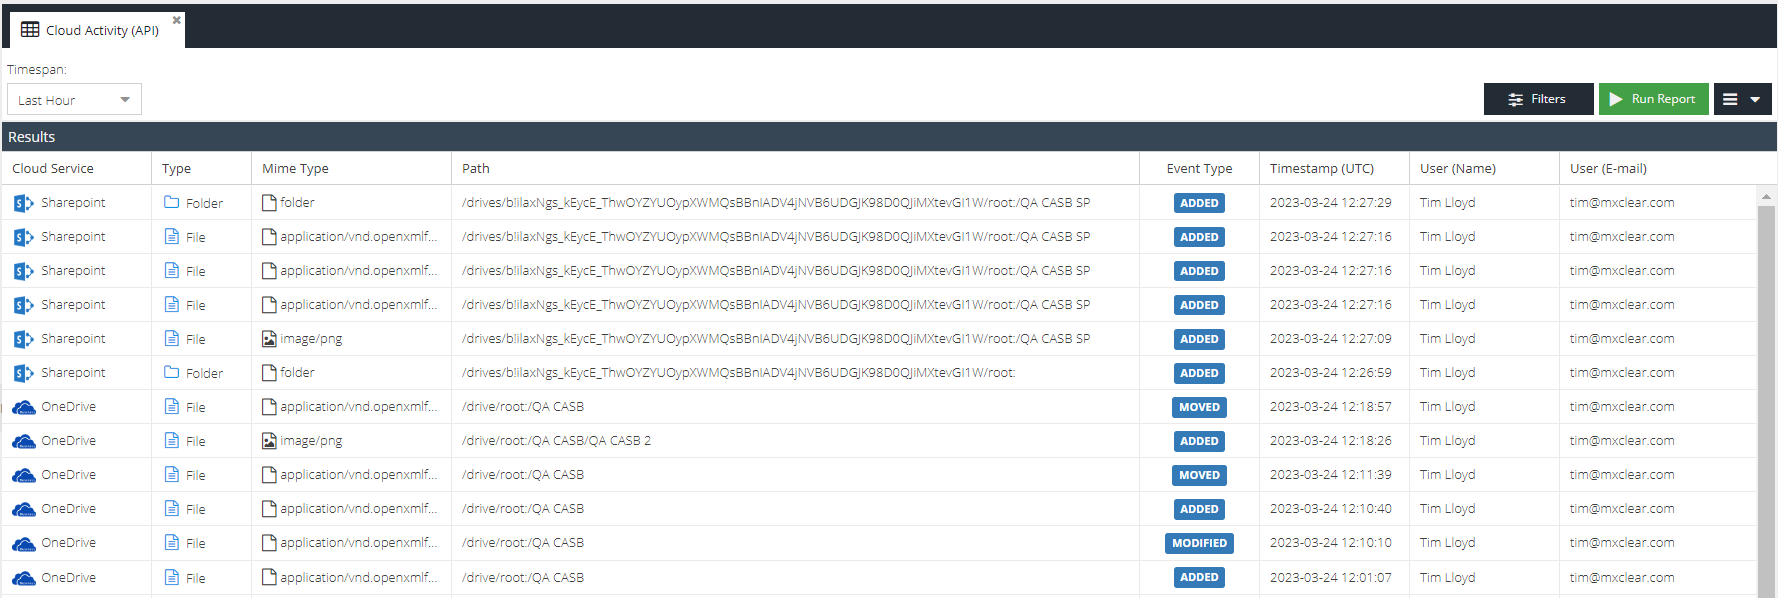
Cloud Activity (API)
The App Activity (API) report is available as part of the Cloud Application Security product and is concerned with providing a detailed analysis of user activity within sanctioned Cloud Storage applications.
The App Activity (API) report allows searching based on the following criteria:
Action Value
A pattern that was captured as part of the file event, such as the filename or folder name
Event Type
The storage event action that took place e.g. Added, Deleted
User (E-mail)
The email address for the user that carried out the file event
User (Name)
The real name for the user that carried out the file event
Type
Whether the file event relates to a file or folder
Cloud Service
A specific sanctioned app e.g. Onedrive for Business
Path
The path that was involved in the file event
Parent name
The folder name that the file belongs to
MIME Type
The MIME type of the file event
Click the  icon to generate the report results. It may take several seconds to generate the report depending on the size of the result set.
The report results will appear in the Results panel and will be ordered by timestamp.
Email Activity
The Email Activity report is available as part of the Email Security product and is concerned with auditing inbound and outbound e-mail processed by the Email Security product. It is the ideal report to track and trace e-mail delivery and to understand what e-mail rules have been applied to the message during processing.
The Email Activity report allows searching based on the following criteria:

Sender IP
The IP address of the sender.
Direction
The direction of the email e.g. inbound, outbound or both.
GUID
A globally unique ID to identify the message (generated by the Email Security system).
Message Rule
A Message Rule that must have matched during processing of the email.
Rule Action
A rule action that must have triggered during processing of the email.
Delivery State
The final delivery state of the message, which may include whether the message was Delayed, Dropped, Delivered, Blocked or experienced a Delivery Error.
Sender Address
Part of the sender email address.
SMTP From
Part of the sender email address.
Recipient
Part of the recipient email address.
Exclude CC/BCC
By default, when searching for a Sender or Recipient, the CC and BCC headers will also be searched. This adds extra overhead to the query and can be disabled, in which case only the TO header will be searched.
Subject
Part of the message subject you are searching for.
Verdict
The status of the message after processing e.g. Delivered, Rejected, Quarantined, Spam, Virus.
Rejected: Email was rejected by a connection rule before being processed. This is usually caused by sender being in the deny list, email being sent to a non-existent mailbox or the exceeding maximum file size
Delayed: Delivery of the email was delayed and most likely timed out. Leading cause being a service outage on the remote host, missing MX record, or DNS issue. More info will be available in the "Server Log" in Details View
Dropped: A remote sending server closed the The TCP session during the payload of the email, this is before a confirmation of the full payload has been received by our services. In these situations the remote server will try again based on their retry settings.
Delivery Error: Refers to the "Delivered" Column. This filter will show emails where the final action was "Deliver", however, the email delivery experienced an error resulting in a fail. Please consult the "Server Log" in the Details View to find find a detailed report of the failure
Blocked: The email was blocked from being delivered by the remote host, most likely caused by tls connection breakdown or firewall. This is a rare and very broad error, more info will be available in the "Server Log" in Details View.
Delivered: Final Action of the email is to "Deliver" and the email received a delivery confirmation from the recipient.
Running the Report
Click the Run Report button to generate the report results. It may take several seconds to generate the report depending on the size of the result set.
The report results will appear in the Results panel and will be ordered by Timestamp (Local) by default.

The default columns are displayed but additional columns can be included in the report. Hover over a column header, and expand the menu to view the available columns. You can add additional columns to the report which will be saved so that the same view appears each time the report is run.
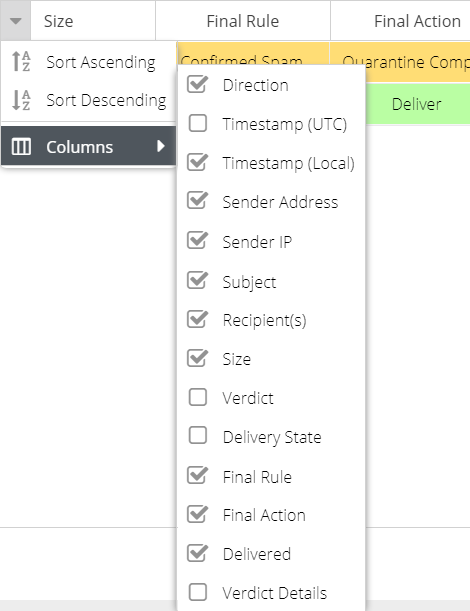
The following columns are available:
Column Name | Description |
Direction | The direction of the email message, e.g. inbound or outbound |
Timestamp (UTC) | The UTC timestamp that the Email Security service MTA processed the email, taking into account the product region in use e.g. EU, US. |
Timestamp (Local) | The local time of the user running the report. This is calculated using the browser offset and converting Timestamp (UTC) |
SMTP Timestamp | The timestamp recorded from the SMTP conversation "EOD" status. Only if Delivery State is "Delivered". |
Sender | The senders email address |
Sender IP | The IP address of the sender |
Subject | The subject of the message |
Recipient(s) | The recipients of the message. The message may be addressed to multiple recipients on the TO header. These will appear as the first recipient plus a counter e.g. |
Size | The size in KB/MB of the message, including attachments |
Verdict | The status of the message after processing e.g. Delivered, Rejected, Quarantined, Spam, Virus |
Delivery State | The final delivery state of the message, which may include whether the message was Delayed, Dropped or Delivered |
Final Rule | The rule name that triggered the Final Action during processing. |
Final Action | The Final Action applied to the rule before processing was stopped |
Delivered | Whether or not the customer email server/service accepted the email for delivery. For full delivery logs, double click the message or click the details icon and then open the Server Log tab. |
Score | If Advanced DLP add-on is active, the score determined by the DLP Scanner for the given message. |
Verdict Details | Additional meta data that was set during rule processing. |
It is possible to sort the results on a particular column by clicking the column header to toggle between ascending and descending sort.
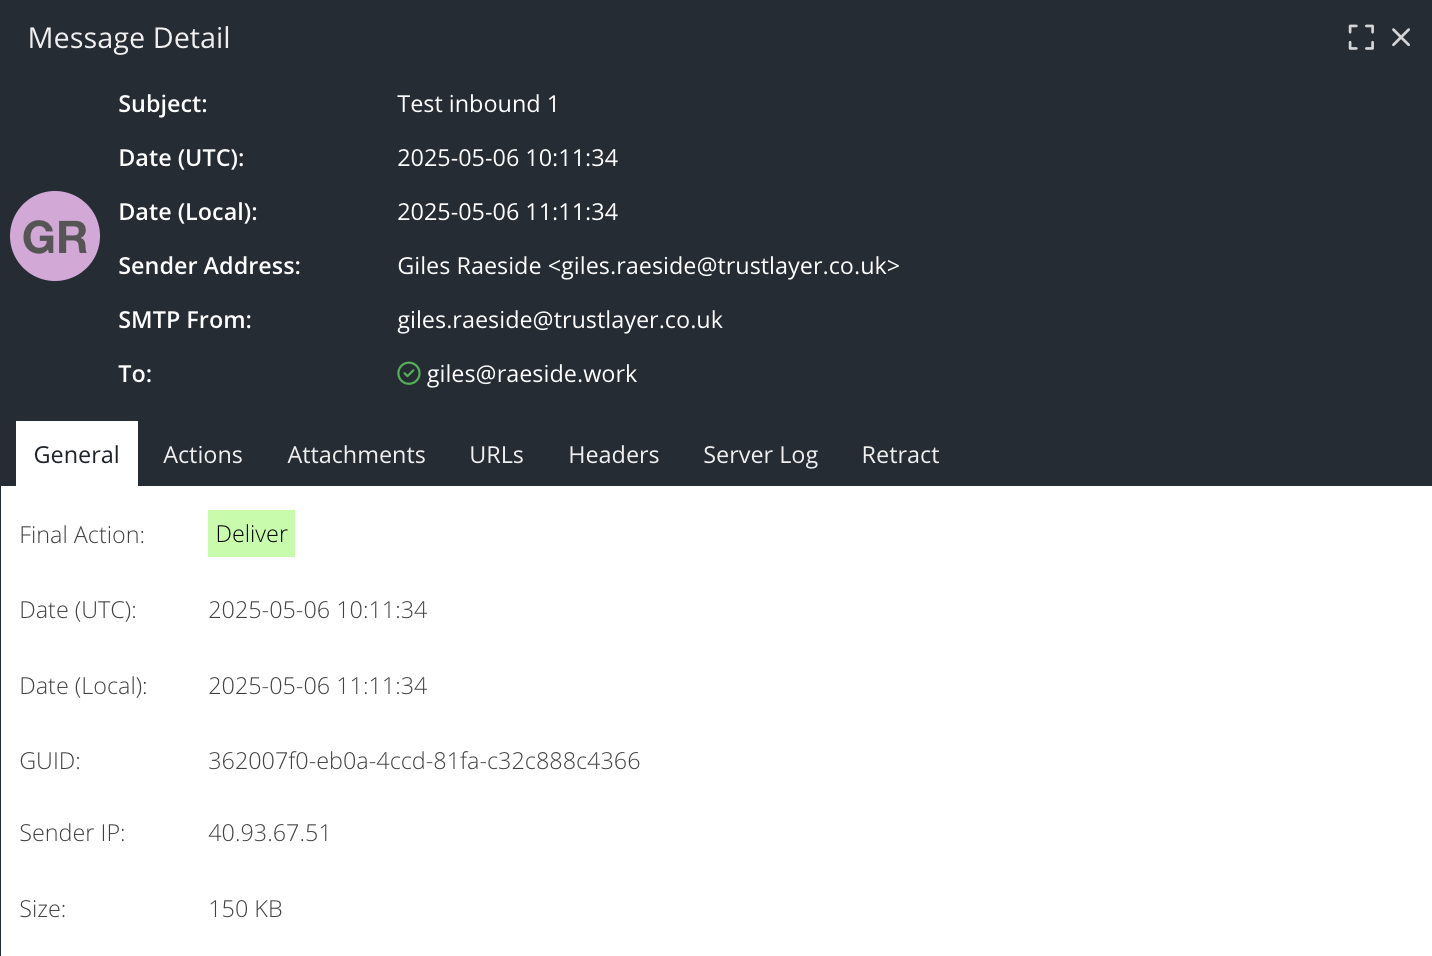
The Email Activity report also captures additional data for every message which is available in the Details View. Double click the message line or click the magnifying glass icon to view the detail on a particular message, which is split up into several tabs.
The General tab shows a summary of the message, with additional CC and BCC recipients
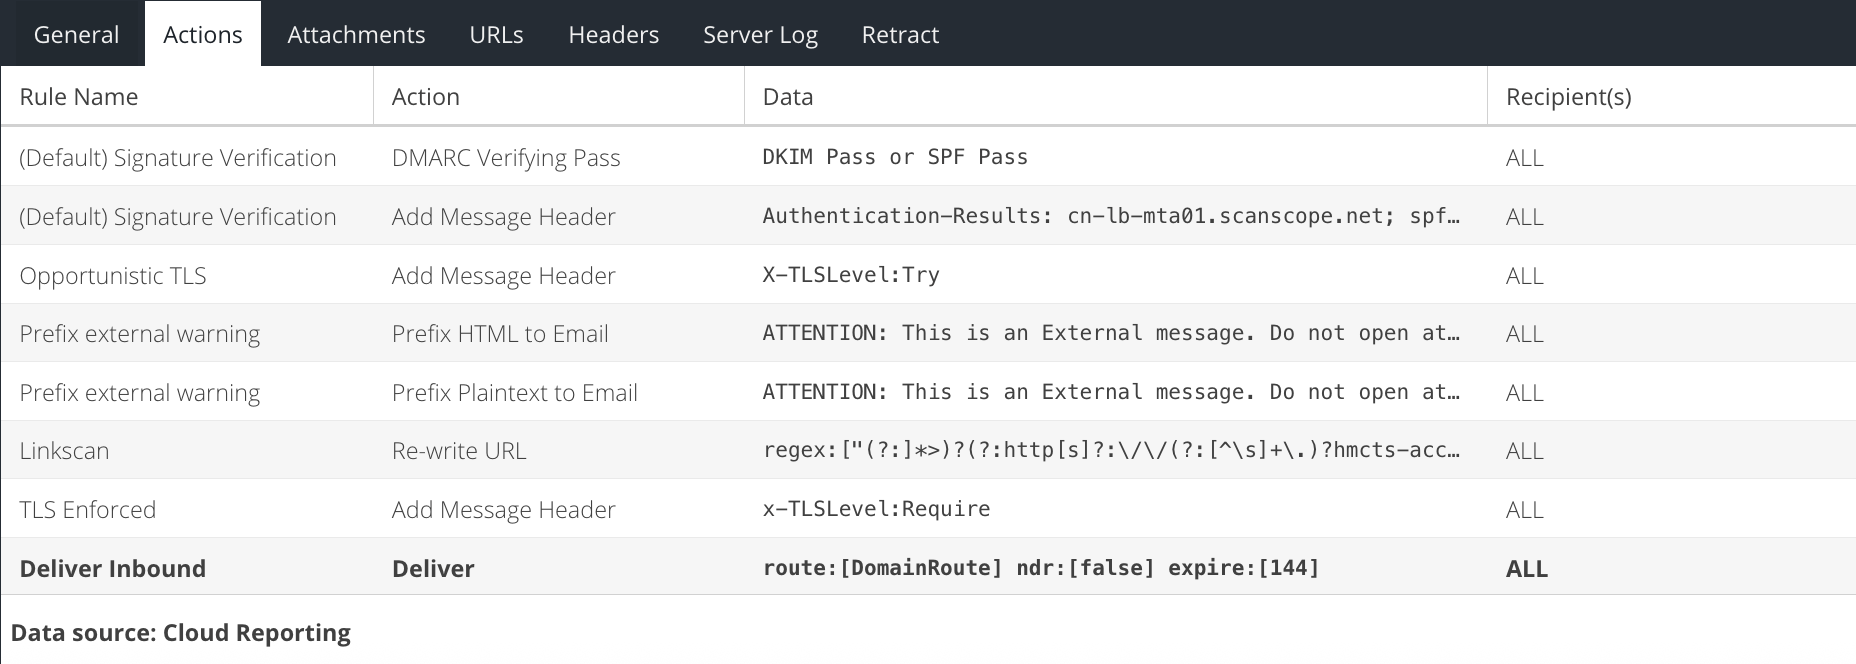
The Actions tab shows the rules that the message triggered as it was processed. This may help to identify why a message ended up with a final status of Deliver, Reject or Quarantine.
The Attachments tab lists the names of any attachments in the message.
The URLs tab lists the full URLs that were captured from the message.

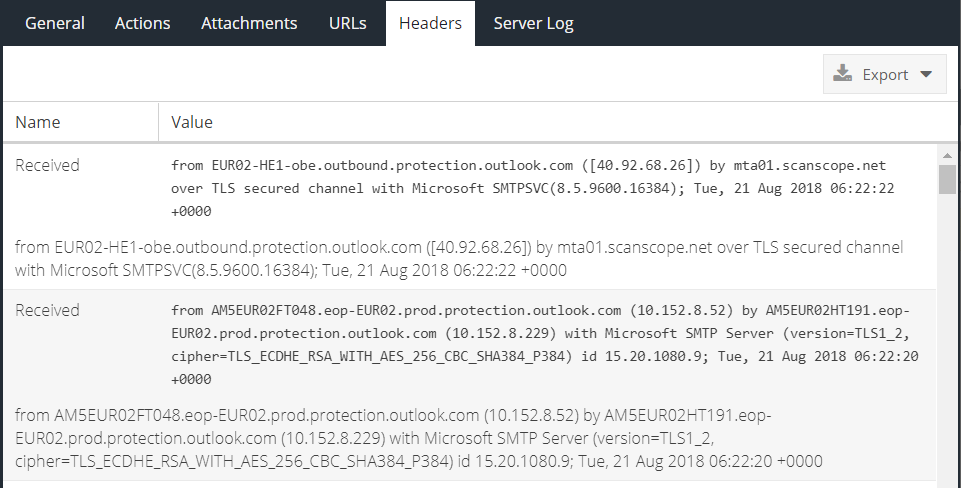
The Headers tab lists the full message headers which can be copied to the clipboard or exported.
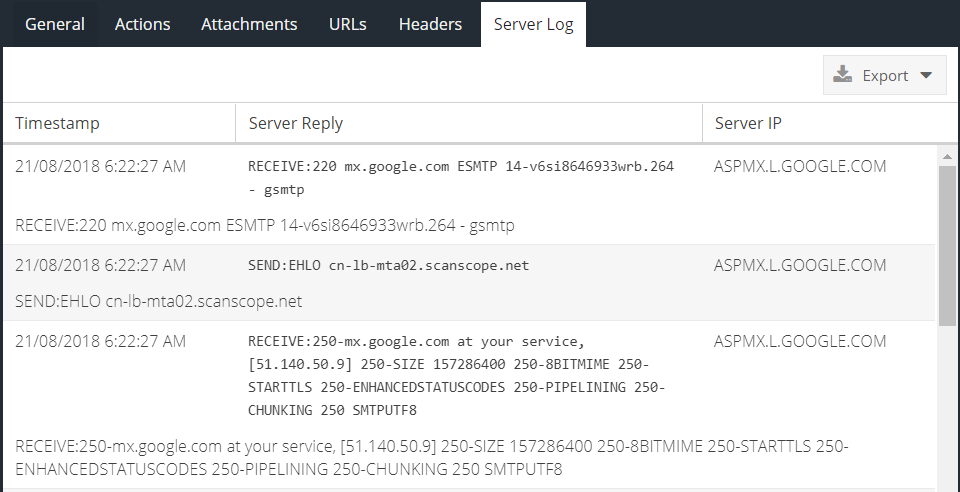
The Server Log tab shows the real SMTP conversation between the Email Security service and the SMTP server that has been configured to receive processed e-mail:
Authentication Activity
The Authentication Activity report is available as part of the MFA powered by IntelliTrust product and is concerned with providing protection for user account compromise through the use of multi-factor authentication.
The Authentication Activity report allows searching based on the following criteria:

Username (UPN)
Part of the users Active Directory username in UPN format e.g. user@domain.local.
End User IP
The end user device IP that made the authentication request. This may be an RFC1918 address.
Auth Client
The type of Authentication Protection Client in use for the authentication attempt, e.g. RADIUS, AD FS.
Login Type
Whether or not the login was successful or failed.
Token
Part of the token number that was entered by the end user.
Click the Run Report button to generate the report results. It may take several seconds to generate the report depending on the size of the result set.
The report results will appear in the Results panel and will be ordered by timestamp.

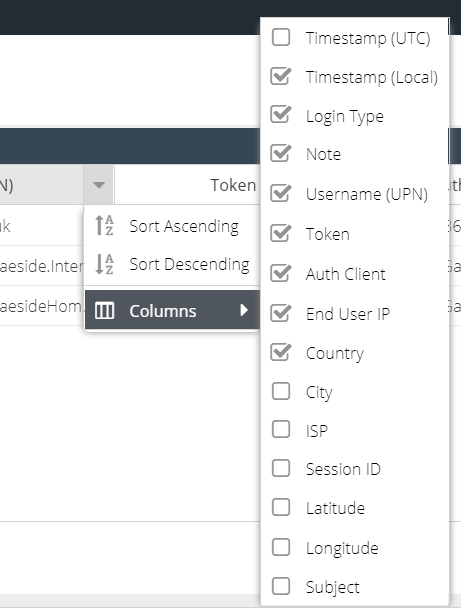
The default columns are displayed but additional columns can be included in the report. Hover over a column header, and expand the menu to view the available columns. You can add additional columns to the report which will be saved so that the same view appears each time the report is run.
The following columns are available:
Column Name | Description |
Timestamp (UTC) | The UTC timestamps of the authentication attempt |
Timestamp (Local) | The local time of the user running the report. This is calculated using the browser offset and converting Timestamp (UTC) |
Login Type | The result of the authentication attempt; success or failure |
Note | Additional information about the Login Type |
Username (UPN) | The username from Active Directory in UPN format (User Principal Name) e.g. user@domain.com |
Token | The token number that was entered by the end user, if available |
Auth Client | The name of the Authentication Client that was used to process the authentication attempt e.g. RADIUS, AD FS |
End User IP | The IP of the user making the authentication request (internal or external) |
Country | If the End User IP is external, the country associated with the external IP |
City | If the End User IP is external, the city associated with the external IP |
ISP | If the End User IP is external, the organization that owns the public IP address |
SessionID | Used for troubleshooting only e.g. to compare with the Event Viewer on the server running an Authentication Client |
Latitude | If the End User IP is external, the latitude of the external IP |
Longitude | If the End User IP is external, the longitude of the external IP |
Subject | Used for troubleshooting only. An internal ID. |
It is possible to sort the results on a particular column by clicking the column header to toggle between ascending and descending sort.
Saving and running Saved reports
Once a report has been generated by completing the search criteria, it can be saved so that it can be easily run again in the future or attached to a Schedule.
To save a report, expand the hamburger menu button which can be found to the right of the Run Report button and click Save:
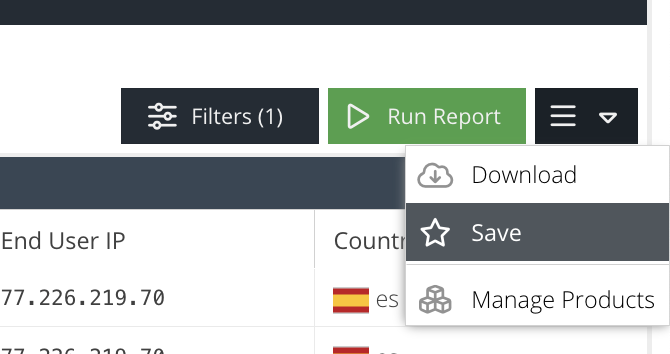
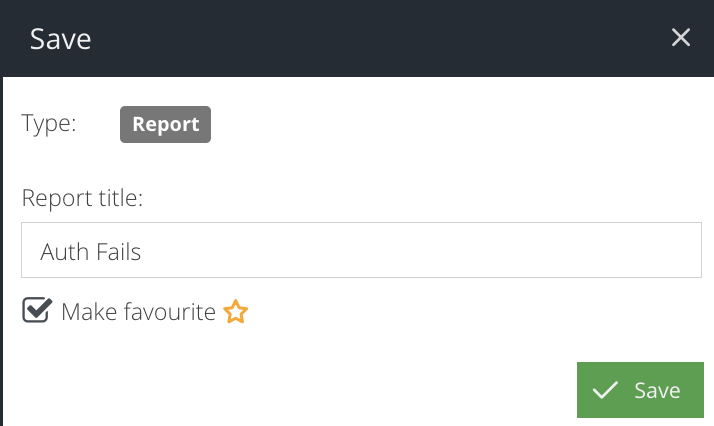
When prompted, enter a name for the report. If you would like the report to be available in the Favourites panel within the Analytics section, tick the Make Favourite checkbox. Click Save again.
The report is now saved. The report is now available from the Saved reports list or within the Schedules section.
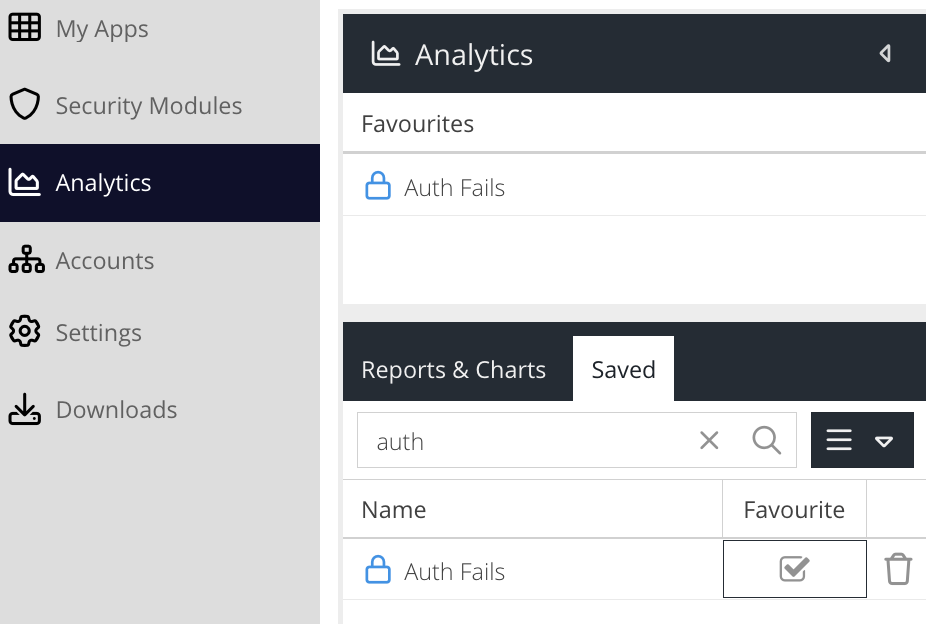
Select a saved report. The saved criteria will be loaded into the form ready to be run. To run the report, click the Run Report button.
Deleting reports
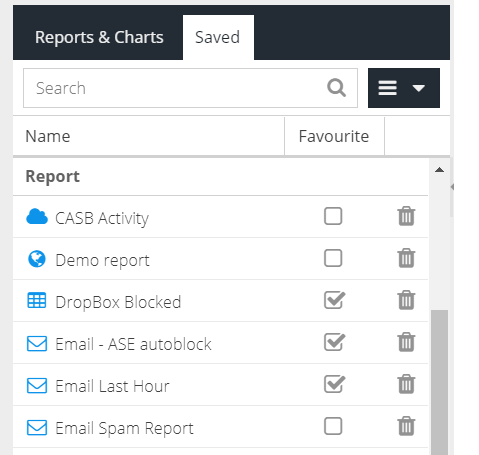
To delete a saved report, navigate to the Saved tab within the Analytics section. Locate the report you wish to delete and click the trash icon.
Download Reports
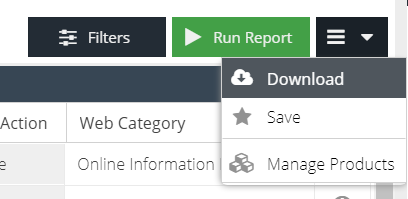
To download a report, first Run the report and generate results. From the hamburger menu, select the Download option.
Activity reports can be exported as Excel or CSV (Comma Separated Values).
Select the report format and enter a recipient of the report. An email will be sent to the recipient once the report has been generated.

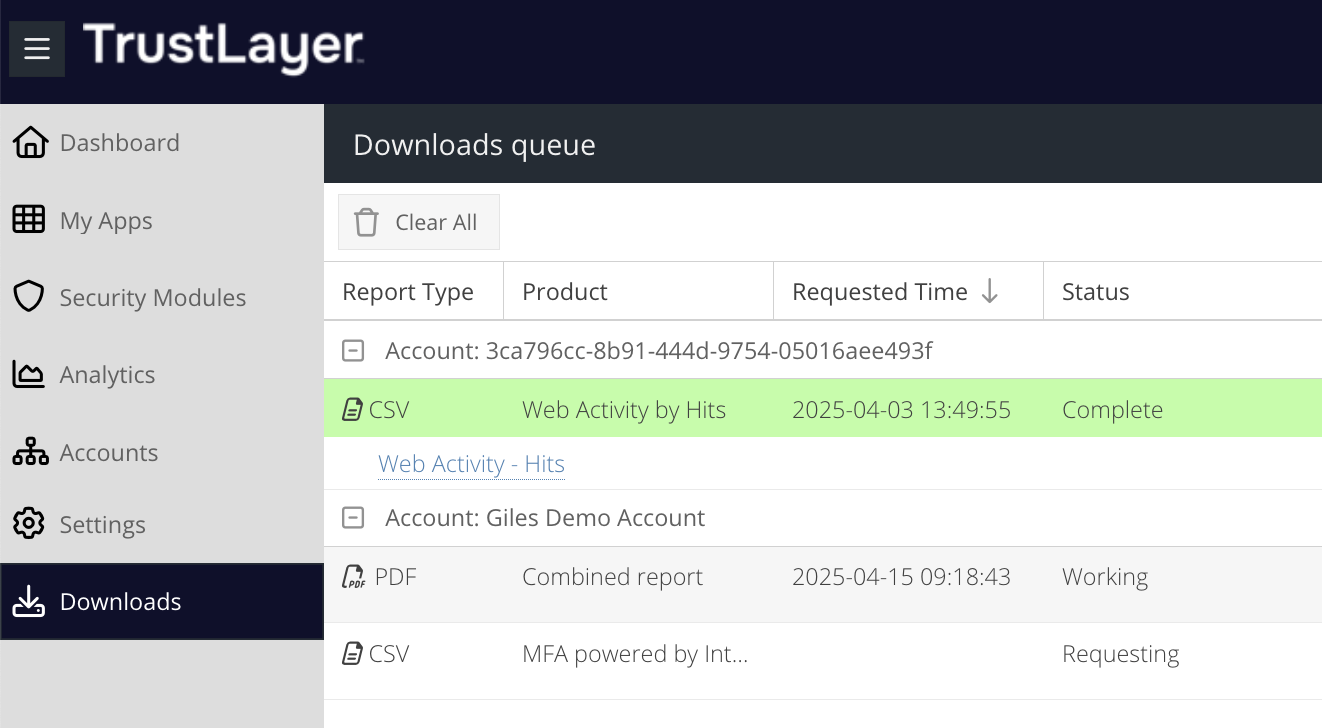
You can view the progress or the result of the download in the Active Downloads section. Once the report is ready, a red flag will indicate it can be downloaded.
