Charts
The Charts section of the Analytics screen allows you to generate chart and table data for any of the charts available to the licensed USS products active on your account. Charts can be downloaded, saved and attached to schedules.
Available charts
The following charts are available for each licensed product:
Web Security
Chart Title | Description |
Top Allowed Domains By Hits | The top domains accessed based on the number of hits across all users or devices |
Top Allowed Users By Hits | The top users that have generated the most hits to allowed sites |
Top Blocked Domains By Hits | The top domains that have been blocked by filter rules,based on the number of hits generated, across all users and devices |
Top Blocked Users By Hits | The top users that have been blocked by filter rules, based on the number of hits generated |
Top Device Hits by IP | The top device IPv4 addresses based on the number of hits generated |
Top Device Hits by MAC | The top device MAC addresses based on the number of hits generated |
Top Device Types by Hits | The top device types (e.g. laptop, desktop, etc) based on the number of hits generated |
Top Domains By Hits | The top domains across all users or devices, allowed or blocked, based on the number of hits generated |
Top Domains By Time Spent | The top domains based on the approximate time spent on the domain by the user or device. The time is calculated by totalling the duration of all the web visits in the time period (see Analytics Terminology section). |
Top Keyword Categories by Hits | The top Keyword categories that matched based on the number of hits across all users and devices |
Top Custom URL Categories by Hits | The top Custom URL categories that matched based on the number of hits across all users and devices |
Top Users By Hits | The top users based on the number of hits generated to allowed or blocked sites |
Top Users By Time Spent | The top users based on the approximate time spent browsing across all domains. The time is calculated by totalling the duration of all the web visits in the time period (see Analytics Terminology section). |
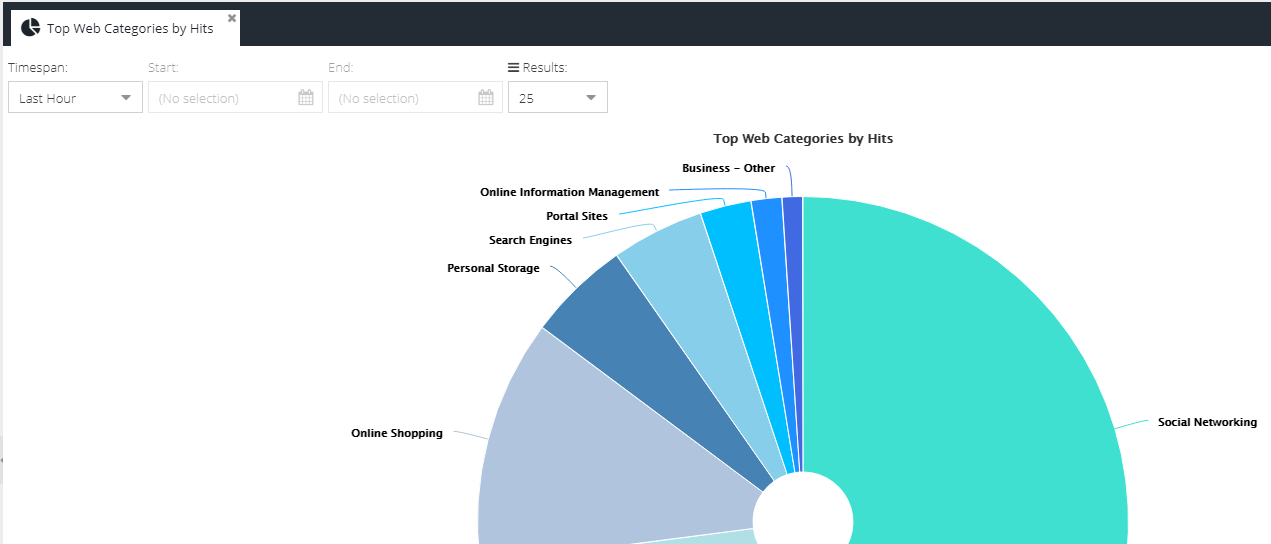
Top Web Categories By Hits | The top Web categories based on the number of hits generated |
Web Browsing Activity | The number of final actions (allow, block, quota, warn, redirect) over time based on all users or devices |
Extended Web Reports
Chart Title | Description |
Top Domains By User or Group | The top domains visited by users with the option to limit to a specific Active Directory group (direct membership) |
Top Users or Groups by Time Spent | The top users by approximate time spent browsing, with the option to limit to a specific Active Directory group (direct membership) |
Top Web Categories by Group | The top Web categories visited by all users with the option to limit to a specific Active Directory group (direct membership) |
Cloud Application Security
Chart Title | Description |
Top Cloud Application Actions | The top actions carried out across all applications by all users and devices (inline mode) |
Top Cloud Application Activity | The top applications used over time by all users and devices (inline mode) |
Top Cloud Application Classes | The top classes of applications used by all users and devices (inline mode) |
Top Cloud Application Locations | The top geographic locations accessed when using cloud applications (inline mode) |
Top Cloud Application Names | The top applications used by all users and devices (inline mode) |
Top Cloud Application Risks | The top high risk actions by all users and devices (inline mode) |
Top Cloud Application Risks (IP) | The top high risk actions used by IPv4 address (inline mode) |
Top Cloud Application Risks (MAC) | The top high risk actions used by MAC address (inline mode) |
Top Cloud Application Risks (User) | The top high risk actions used by username (inline mode) |
Top MIME Types Transferred (API) | The top MIME types from uploaded files to connected cloud applications (API mode only) |
Top Storage Actions by Country (API) | The top countries carrying out storage actions (e.g. add, delete, modify) across all users (API mode only) |
Top Storage Actions by Events (API) | The top storage actions (e.g. add, delete, modify) across all users (API mode only) |
Top Storage Apps (API) | The top storage apps in use (API mode only) |
Top Storage Users by Activity (API) | The top users using connected applications (API mode only) |
Top Users of Cloud Applications | The top users using cloud applications from the App Catalog (inline mode) |
Violation Activity (API) | The top violations detected in connected applications (API mode only) |
Email Security
Chart Title | Description |
E-mail Volume | The number of inbound vs outbound messages over time |
Inbound E-mail Activity | The number of inbound messages over time that were delivered, rejected, spam or virus |
Top E-mail Actions | The top email actions triggered based inbound messages |
Top E-mail Rules | The top rules that triggered based inbound messages |
Top Final Actions | The top final actions that triggered based on inbound messages |
Top Final Rules | The top rules that triggered final actions based on inbound messages |
Top Recipients | The top recipients that have received inbound messages |
Top Senders | The top senders based on number of messages sent |
Top Spam Recipients | The top recipients of messages containing spam |
Top Virus Recipients | The top recipients of messages containing a virus or malware |
Multi-Factor Authentication
Chart Title | Description |
Authentication Activity | The number of success or failed authentication attempts over time |
Failed Logins by Client Type | The number of failed authentication attempts over time by the client type (e.g. RADIUS, AD FS) |
Failed Logins by Country | The number of failed authentication attempts by country |
Successful Logins by Client Type | The number of successful authentication attempts over time by the client type (e.g. RADIUS, AD FS) |
Successful Logins by Country | The number of successful authentication attempts by country |
Success vs Failed Login Attempts | The number of success and failed authentication attempts |
Top Failed Logins by User | The number of failed authentication attempts by user |
Top Successful Dispatch Policies Used | The number of dispatch policies used for successful authentication attempts |
Top Successful Logins by User | The number of successful authentication attempts by user |
Generating a Chart report
To access the Charts section, visit your USS Dashboard and click Analytics ⟶ Reports & Charts.
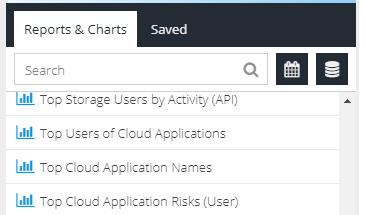
Select a chart from the list or search by chart name. Selecting a chart will open the chart in the right-hand panel.
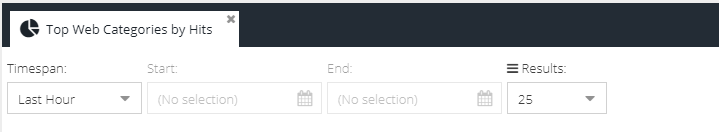
There are several options available for generating a chart:
Timespan
Select a relative period e.g. Last Day, Last Week or enter a specific range with a start and end date/time
Results
Select the number of results to show on the chart
AD Group
For Extended Web Reports, you can also limit the chart results to specific Active Directory groups
After making any changes, click the  button.