Charts
 Updated 3 hours ago
by
admin
Updated 3 hours ago
by
admin
The Insights page shows charts for the modules licensed on your account. You choose which charts appear, and you can click any part of a chart to open the matching detailed report.
In the console, click Insights in the left-hand menu.
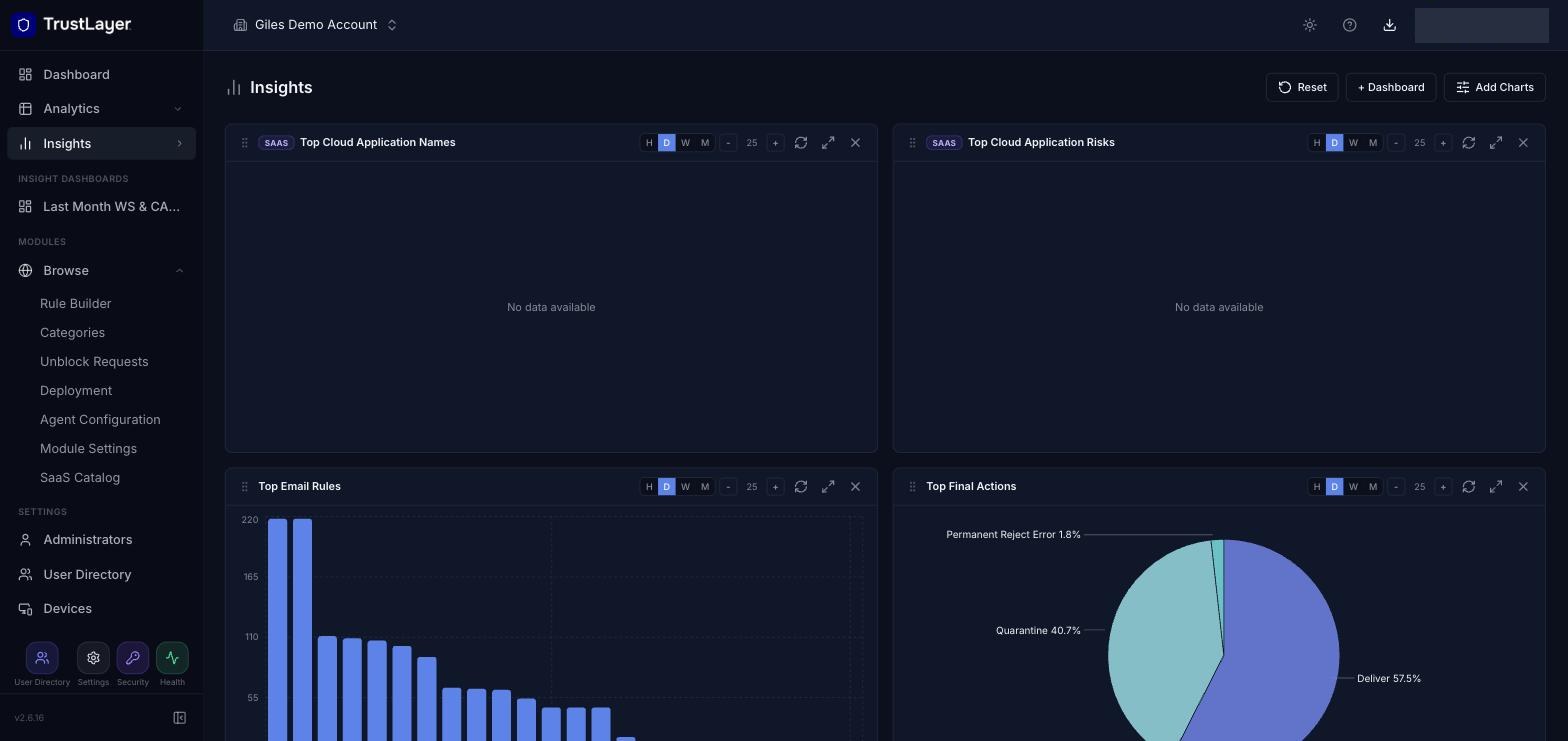
Chart controls
Each chart has controls in its title bar:
- H, D, W, M: show the last hour, day, week or month.
- - and +: decrease or increase the number of results shown (e.g. top 25).
- Refresh data: reload the chart.
- Maximise: show the chart full size.
- Remove chart: remove it from the page.
- Drag the handle on the left of the title to reorder the charts.
Adding and removing charts
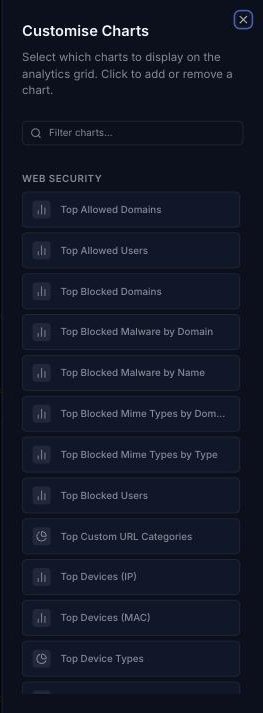
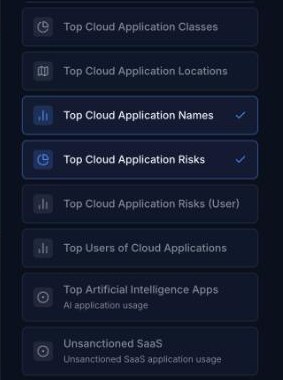
Click Add Charts at the top right. In the Customise Charts panel, click a chart to add it to or remove it from the page. Use Filter charts to search. Click Reset to go back to the default set of charts.
Drilling down into a chart
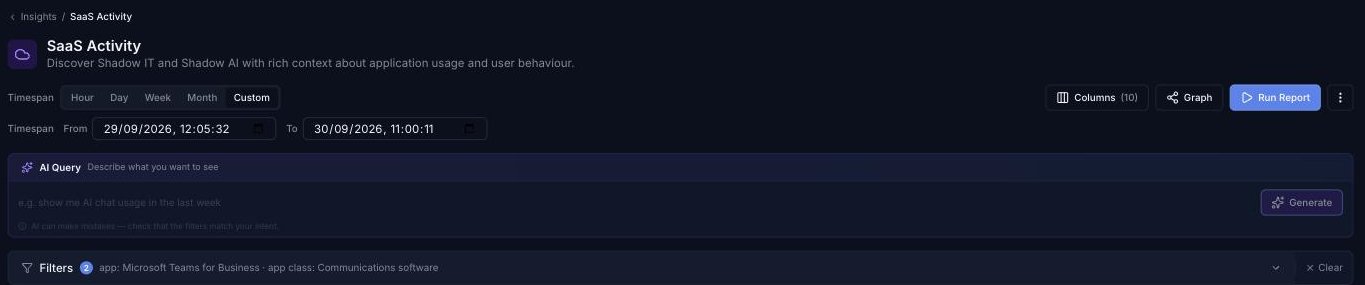
Click a bar or slice of a chart to open the matching report (for example Web Activity or SaaS Activity) with the timespan and filters already set to that item. You can then change the filters, save the report or download it. See Activity Reports.
When you drill down from a Web Categories chart, the Web Category filter is set to the category you clicked. Use the Show Selected toggle in the filter to list only the selected categories.
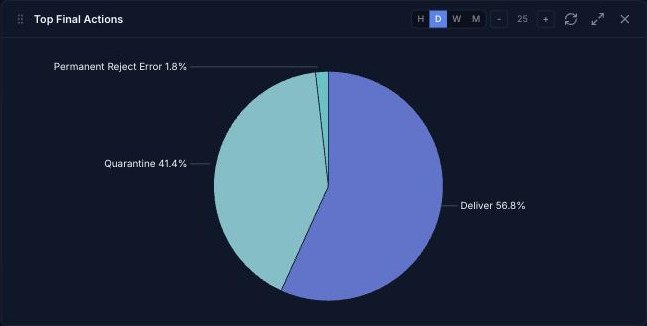
Pie charts label each slice with its share of the total.
AI Observability and Unsanctioned SaaS
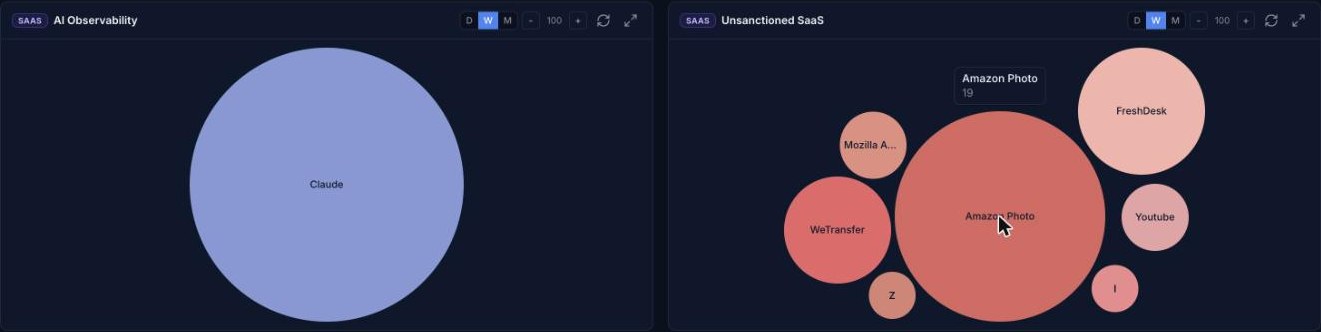
Two SaaS widgets give a quick view of AI and Shadow IT use. Add them from Add Charts (under Cloud Application Control). They are also shown on the console Dashboard.
- Top Artificial Intelligence Apps (shown as AI Observability on the Dashboard): the AI applications in use.
- Unsanctioned SaaS: the unsanctioned SaaS applications in use.
Each app is shown as a bubble sized by its amount of activity. Hover over a bubble to see the count, or click it to open SaaS Activity filtered to that app. These widgets offer D, W and M (last day, week or month) and show up to 100 results by default.
Insight Dashboards
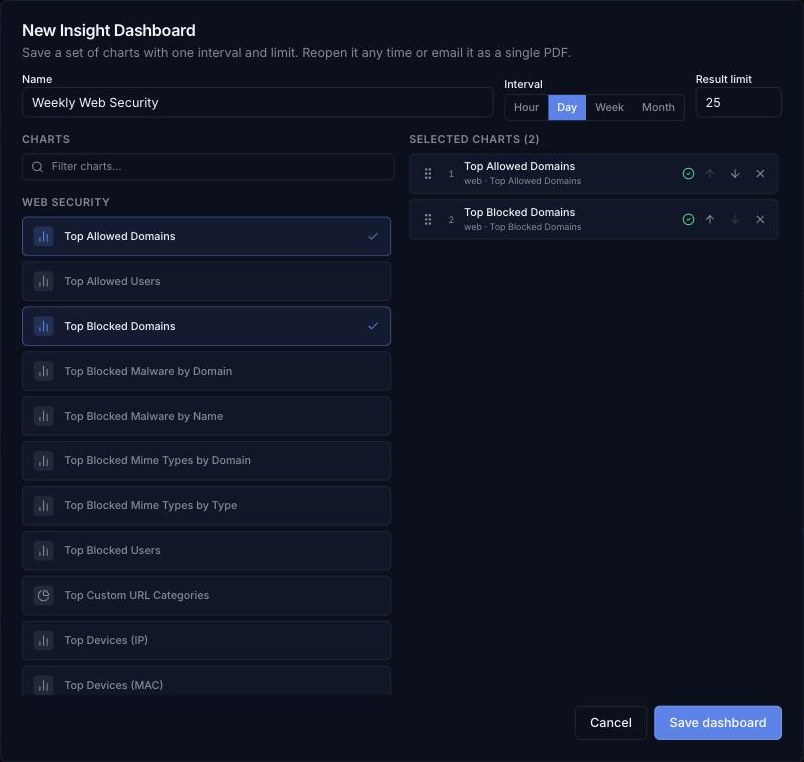
An Insight Dashboard saves a set of charts with one interval and result limit, so you can reopen them together and download them as a single PDF.
Creating a dashboard
- On the Insights page, click + Dashboard.
- Enter a Name.
- Choose the Interval (Hour, Day, Week or Month) and the Result limit (for example 25).
- Click charts in the Charts list to add them. Use Filter charts to search. Under Selected charts, use the arrows or drag handle to change the order, and the cross to remove a chart.
- Click Save dashboard.
Viewing a dashboard
Saved dashboards are listed under Insight Dashboards in the left-hand menu. Click one to open it. Click Download PDF to download all its charts as one PDF, or the bin icon to delete the dashboard. Click Back to Insights to return.

Available charts
The charts in the Customise Charts panel depend on the modules licensed on your account.
Web Security
Chart | Description |
Top Allowed Domains | The top domains accessed, based on the number of hits across all users or devices |
Top Allowed Users | The users that generated the most hits to allowed sites |
Top Blocked Domains | The top domains blocked by rules, based on the number of hits |
Top Blocked Malware by Domain | The domains where the most malware was blocked |
Top Blocked Malware by Name | The most frequently blocked malware, by name |
Top Blocked Mime Types by Domain | The domains with the most blocked file (MIME) types |
Top Blocked Mime Types by Type | The most frequently blocked file (MIME) types |
Top Blocked Users | The users blocked by rules most often, based on the number of hits |
Top Custom URL Categories | The top Custom URL categories matched, based on the number of hits |
Top Devices (IP) | The top device IPv4 addresses, based on the number of hits |
Top Devices (MAC) | The top device MAC addresses, based on the number of hits |
Top Device Types | The top device types (for example laptop or desktop), based on the number of hits |
Top Domains | The top domains, allowed or blocked, based on the number of hits |
Top Keyword Categories | The top Keyword categories matched, based on the number of hits |
Top Operating Systems | The top operating systems, based on the number of hits |
Top Users | The top users, based on the number of hits to allowed or blocked sites |
Top Web Categories | The top Web categories, based on the number of hits |
Web Browsing Activity | The number of final actions (allow, block, quota, warn, redirect) over time |
Cloud Application Control
Chart | Description |
Top Cloud Application Actions | The top actions carried out across all applications |
Top Cloud Application Activity | The top applications used over time |
Top Cloud Application Classes | The top classes of applications used |
Top Cloud Application Locations | The top geographic locations accessed when using cloud applications |
Top Cloud Application Names | The top applications used |
Top Cloud Application Risks | The top high-risk actions |
Top Cloud Application Risks (User) | The top high-risk actions, by username |
Top Users of Cloud Applications | The top users of cloud applications from the SaaS Catalog |
Top Artificial Intelligence Apps | AI application usage (AI Observability) |
Unsanctioned SaaS | Unsanctioned SaaS application usage |
Email Security
Chart | Description |
Email Volume | The number of inbound and outbound messages over time |
Inbound Email Activity | The number of inbound messages over time that were delivered, rejected, spam or virus |
Top Email Actions | The top email actions triggered by inbound messages |
Top Email Rules | The top rules triggered by inbound messages |
Top Final Actions | The top final actions triggered by inbound messages |
Top Final Rules | The top rules that triggered final actions on inbound messages |
Top Recipients | The top recipients of inbound messages |
Top Senders | The top senders, based on the number of messages sent |
Top Spam Recipients | The top recipients of spam |
Top Virus Recipients | The top recipients of messages containing a virus or malware |
Cloud MFA
Chart | Description |
Authentication Overview | Successful and failed authentication attempts over time |
Failed Logins (Auth Client) | Failed authentication attempts by client type (for example RADIUS or AD FS) |
Failed Logins (Country) | Failed authentication attempts by country |
Successful Logins (Auth Client) | Successful authentication attempts by client type |
Successful Logins (Country) | Successful authentication attempts by country |
Success vs Failed Login Attempts | The number of successful and failed authentication attempts |
Top Failed Logins (User) | Failed authentication attempts by user |
Top Successful Logins (User) | Successful authentication attempts by user |