SAT - Reports Package Comparison
Reports packages
Reports helps your organisation measure, understand and reduce human cyber risk. It is available in two packages, Essentials and Enhanced, which give different depths of insight.
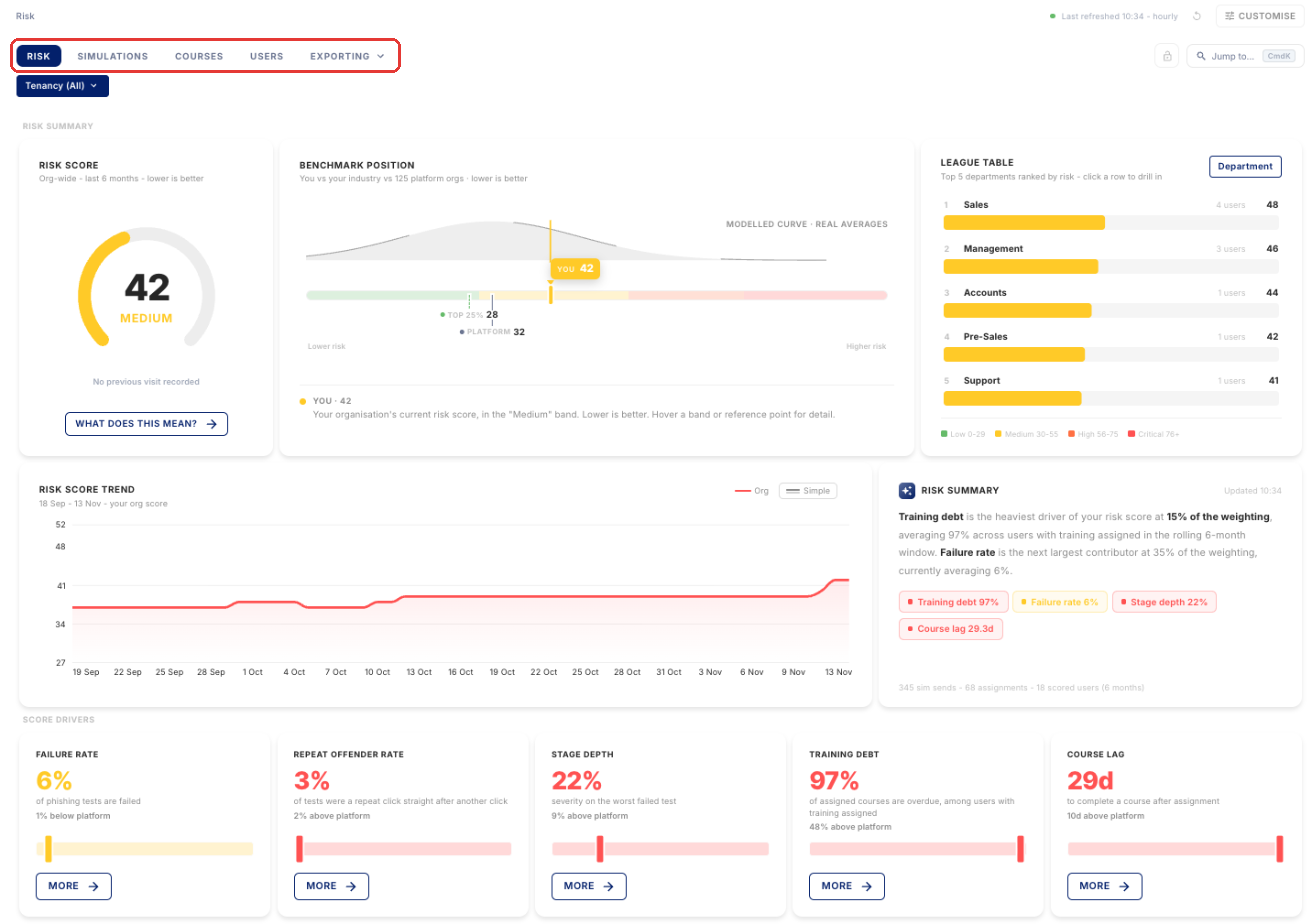
The Risk page above is from a tenancy with Enhanced. The Benchmark Position and Risk Summary widgets are only available in Enhanced.
Essentials
Essentials covers the core of Reports:
- Your organisation's Risk Score, its trend over the last 6 months and the five score drivers.
- A League Table of your riskiest departments, locations or groups.
- Headline simulation and course performance, with click, report and completion breakdowns by group.
- Full user, simulation and course tables, with exports for each table.
Enhanced
Enhanced includes everything in Essentials, plus:
- Industry benchmarking: compare your risk factors against anonymised peer averages.
- AI risk highlights: a written summary of what is driving your Risk Score.
- Flagged simulations: an inbox of flagged simulations, with lure and timing analysis.
- Repeat clickers: users who click again straight after a previous click.
- Export Builder: board, exec, ops and compliance templates in PDF, PowerPoint, Excel and CSV. See SAT - Reports Exporting.
Full comparison
| Feature | Essentials | Enhanced |
|---|---|---|
| Pages | ||
| Risk, Simulations, Courses and Users tabs (dashboards with drill-downs and user profiles) | ✓ | ✓ |
| Per-table exports | ✓ | ✓ |
| Industry benchmarking (peer averages on every risk factor) | – | ✓ |
| Flagged simulations page | – | ✓ |
| Export Builder (PDF, PowerPoint, Excel and CSV templates) | – | ✓ |
| Risk | ||
| Risk Score (0–100, band, change since last visit) | ✓ | ✓ |
| Risk Score Trend (last 6 months) | ✓ | ✓ |
| Score drivers (five factors with drill-downs) | ✓ | ✓ |
| League Table (top 5 departments, locations or groups) | ✓ | ✓ |
| Benchmark Position | – | ✓ |
| Risk Summary (AI highlights) | – | ✓ |
| Simulations | ||
| Total Sends, Failure Rate, 2nd Stage Rate, Report Rate | ✓ | ✓ |
| Clicks by Date | ✓ | ✓ |
| Click Rate by Group | ✓ | ✓ |
| Click Rate by Simulation | ✓ | ✓ |
| Simulation Engagement | ✓ | ✓ |
| Reporting Trend | ✓ | ✓ |
| All Simulations, Users and Send History (drillable tables) | ✓ | ✓ |
| Repeat Clickers | – | ✓ |
| Flagged Simulations (count) | – | ✓ |
| Clicks by Device | – | ✓ |
| When Users Click (heat grid) | – | ✓ |
| Click vs Report | – | ✓ |
| Lure Effectiveness | – | ✓ |
| Time to Click | – | ✓ |
| Courses | ||
| Courses Sent, Completion Rate, Avg Score, Pass Rate, Avg Pass Score | ✓ | ✓ |
| Training Debt and Avg Course Lag | ✓ | ✓ |
| Sends vs Completions | ✓ | ✓ |
| Outstanding Users | ✓ | ✓ |
| Completion by Group | ✓ | ✓ |
| Score Breakdown by Course | ✓ | ✓ |
| All Courses, Users and Course Send History (drillable tables) | ✓ | ✓ |
| Course Lag curve | – | ✓ |
| Department by Type Heatmap | – | ✓ |
| Score Breakdown by Type | – | ✓ |
To find out which package your tenancy has, or to upgrade to Enhanced, please contact your TrustLayer account manager.