Dashboard
 Updated 2 hours ago
by
admin
Updated 2 hours ago
by
admin
The Dashboard is the first page you see when you sign in to the console. It gives an overview of your security modules, AI and SaaS use, licence usage and service status.
To return to it at any time, click Dashboard at the top of the left-hand menu.
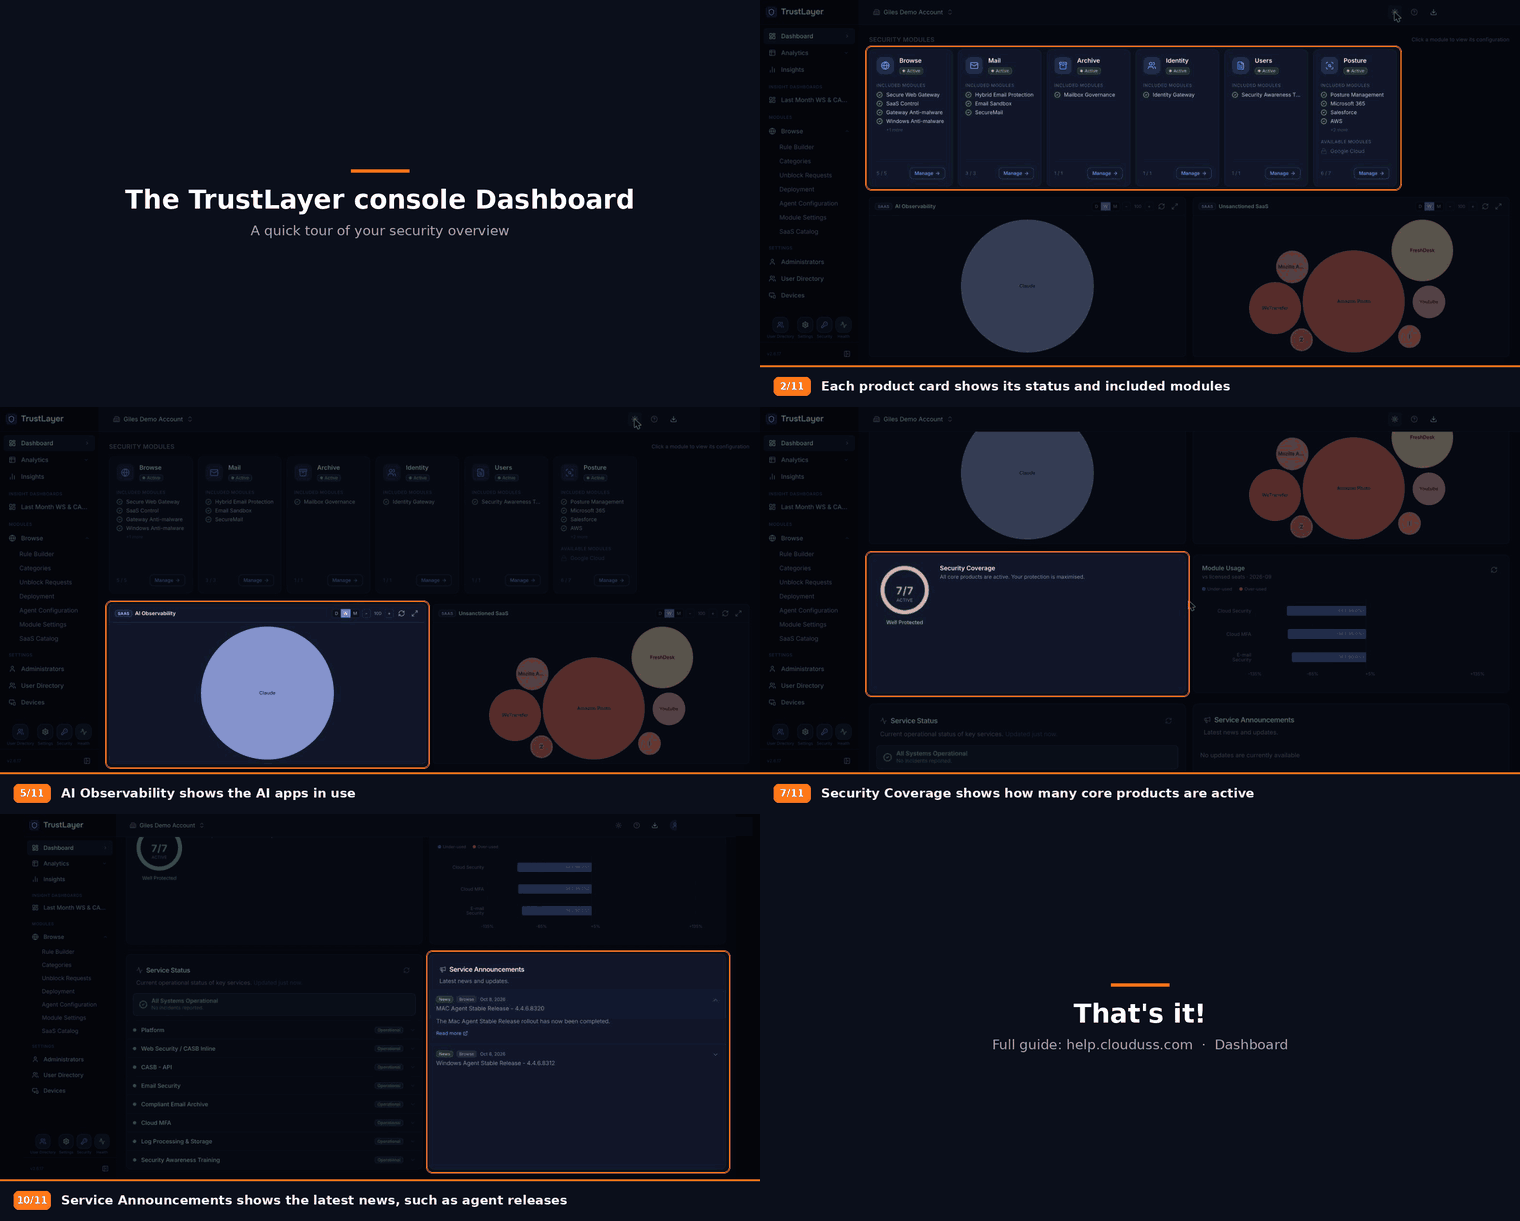
Video walkthrough
Security modules
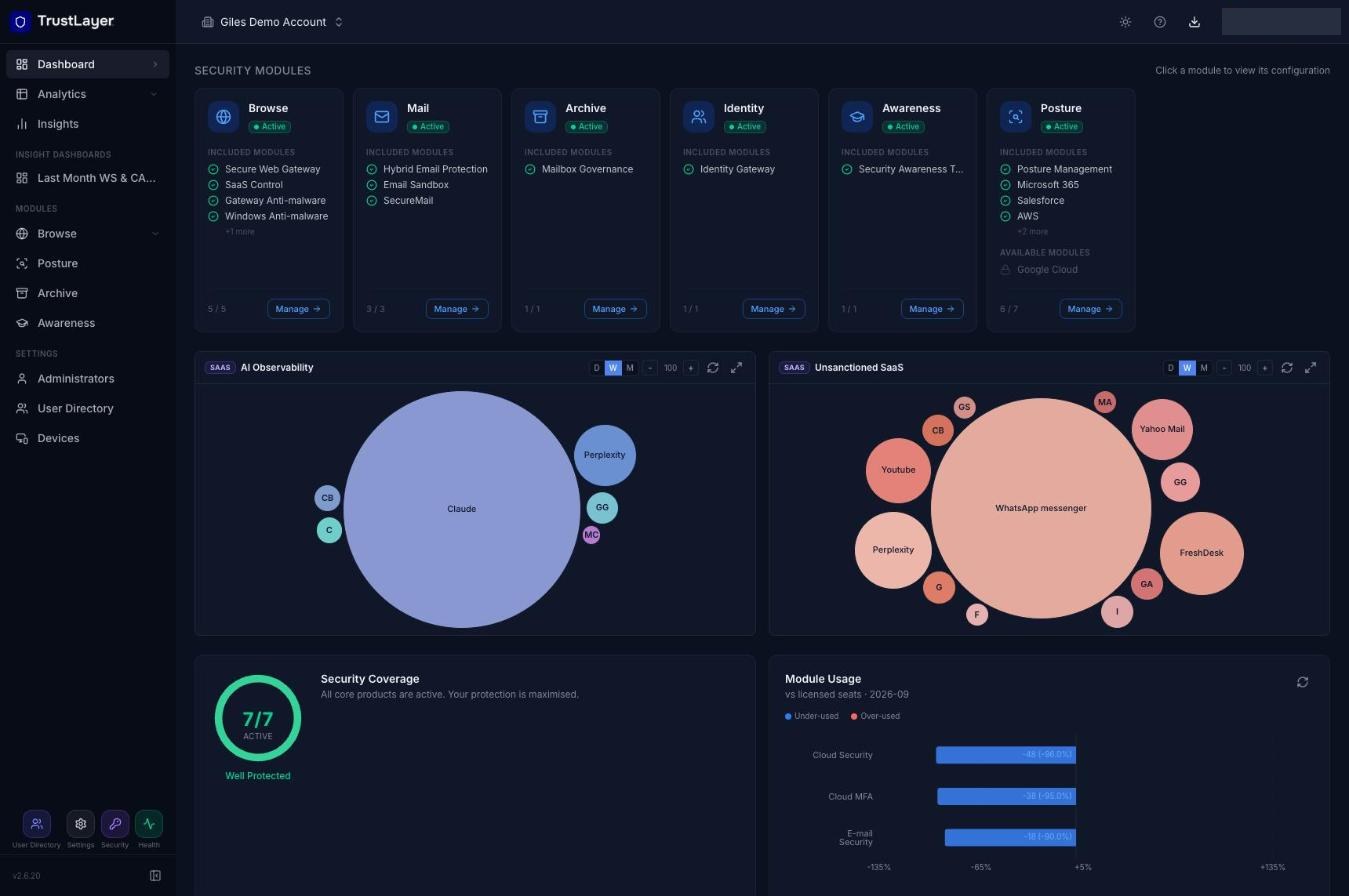
Each product on your account has a card (for example Browse, Mail, Archive, Identity, Awareness and Posture). Each card shows:
- the product's status, for example Active;
- Included modules: the modules you have (click +N more to see the rest);
- Available modules: modules you could add, shown with a padlock;
- how many of the product's modules you have, for example 6 / 7.
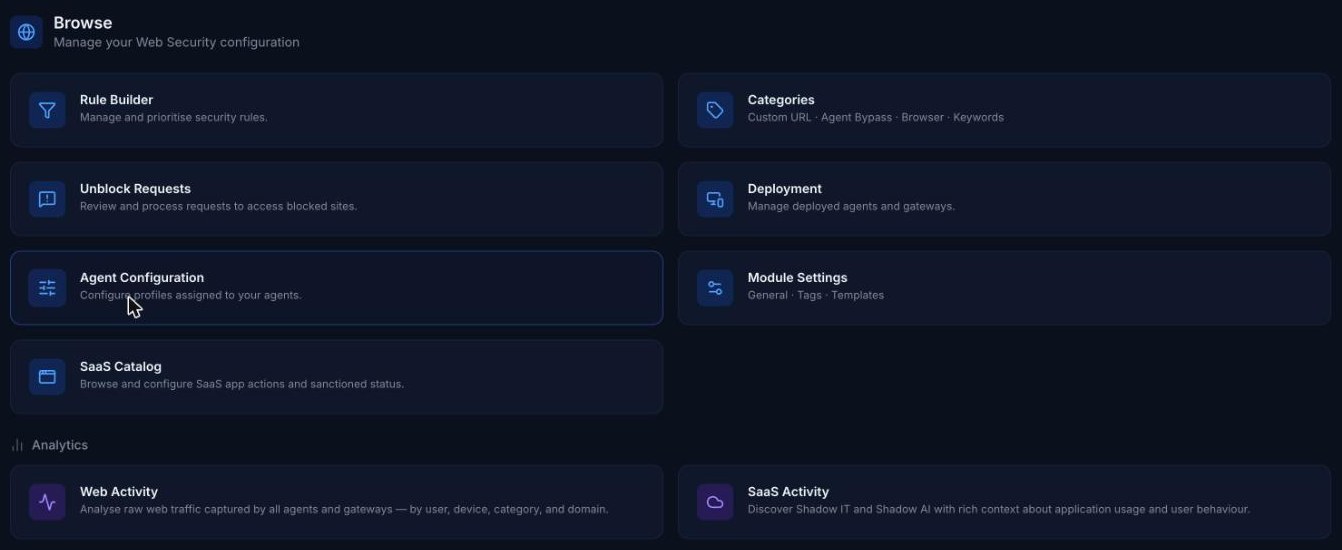
Click Manage on a card to open that product. Browse opens an overview with links to the Rule Builder, Categories, Unblock Requests, Deployment, Agent Configuration, Module Settings, SaaS Catalog, and the Web Activity and SaaS Activity reports.
If they are licensed, Manage on the Archive, Awareness and Posture cards signs you in to Compliant Email Archive, Security Awareness Training and Posture Management. You can also click Archive, Awareness or Posture under Modules in the left-hand menu.
AI Observability and Unsanctioned SaaS
These two widgets show the AI applications and the unsanctioned SaaS applications in use, as bubbles sized by activity. Hover over a bubble to see the count, or click it to open SaaS Activity filtered to that app. Use D, W and M to show the last day, week or month. You can also add them to the Insights page or an Insight Dashboard. See Charts.
Security Coverage and Module Usage
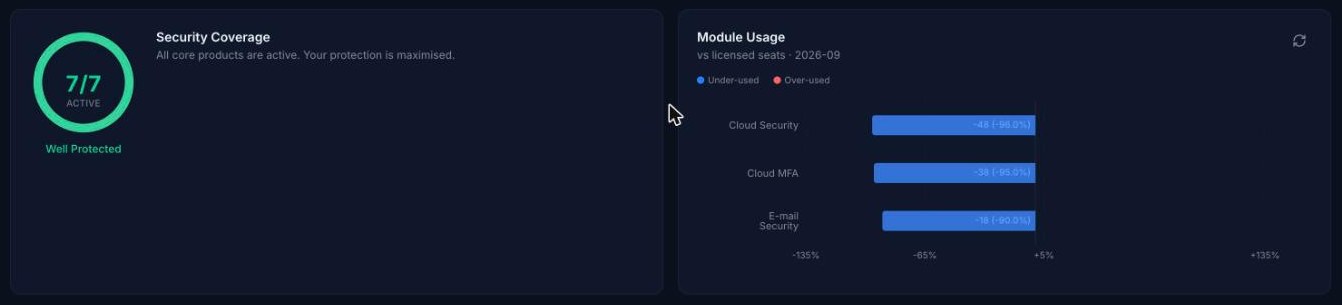
- Security Coverage shows how many of your core products are active, for example 7/7 Active (Well Protected).
- Module Usage compares the seats used with the seats licensed for each module for the month shown. Blue bars are under-used and red bars over-used, with the difference as a number and a percentage. Click the refresh button to reload it. Browse may still appear under its old name, Cloud Security.
Service Status and Service Announcements
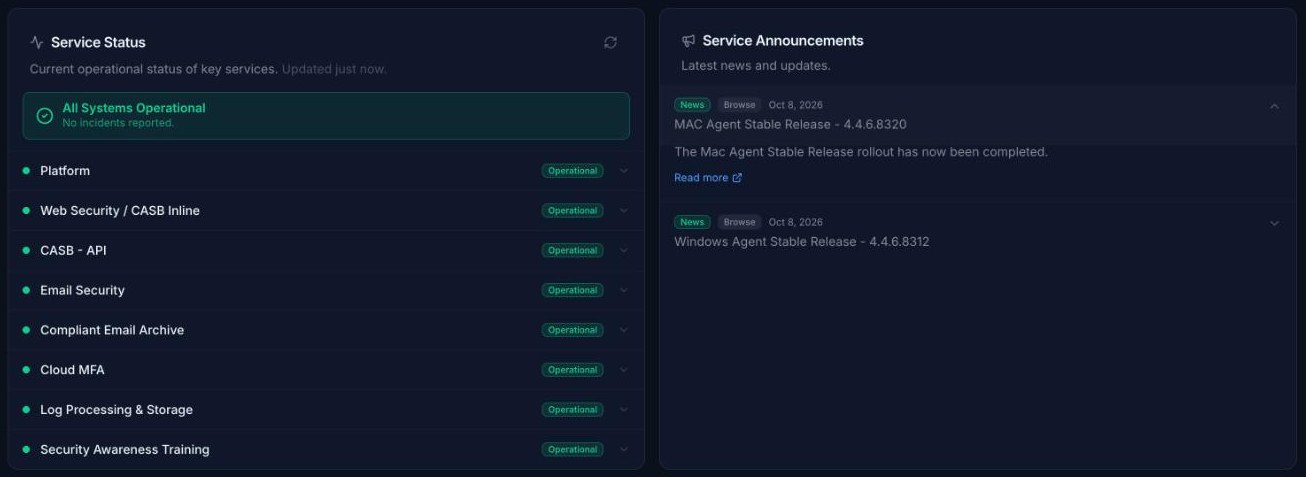
- Service Status shows the current status of TrustLayer services, with a summary at the top (for example All Systems Operational). Click the arrow on a service, such as Platform, to see the status of its components. Click the refresh button to update it.
- Service Announcements shows the latest news and updates from TrustLayer, such as new agent releases. Each announcement shows its type (for example News), the product it relates to and the date. Click an announcement to expand it, and click Read more for the full details.
Getting Started guide and the Help menu
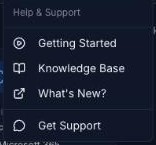
Click the Help icon (?) at the top right of the console to open Help & Support:
- Getting Started: opens the Getting Started guide.
- Knowledge Base: opens the TrustLayer knowledge base.
- What's New?: opens the console change log. You can also click the version number at the bottom of the left-hand menu.
- Get Support: contact TrustLayer support.
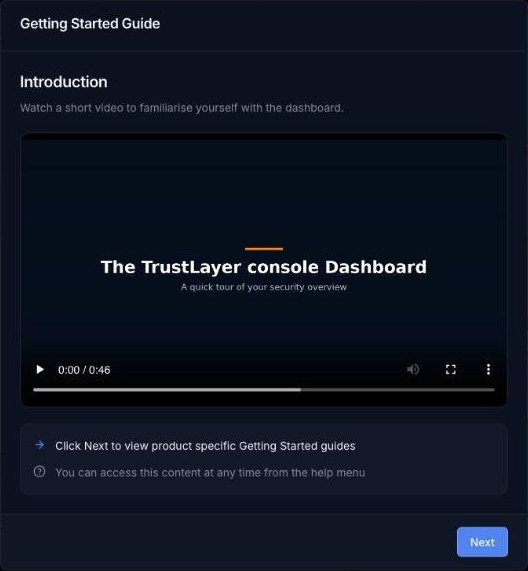
The Getting Started Guide starts with a short video tour of the Dashboard. Click Next for product-specific Getting Started guides, then Close. Tick Do not show this again if you don't want the guide to appear automatically. It's always available from the Help menu.